Reading a small Data Matrix code starts with resolving its individual light and dark cells. A reader may support the symbology, yet the actual sample still needs enough image detail, usable contrast and repeatable positioning in the finished device.
This XL-F42 demonstration shows a customer-specific sample based on the XL-F42 platform, reading a 0.8 × 0.8 mm Data Matrix on a 1.3 × 1.3 mm part. Xinlong IoT has confirmed both dimensions. The wired reader is connected to a laptop, and the operator presents the small sample in front of it. Data lines appear in the host window during the demonstration.
For OEM engineers evaluating a micro Data Matrix scanner, the case provides a practical starting point: establish the code dimensions, inspect its image detail, then reproduce the conditions in the final assembly.
XL-F42 custom sample video
Watch the original XL-F42 custom sample demonstration on YouTube.
The video shows this particular sample and bench setup. The checks below explain how to turn that demonstration into an application-specific evaluation.
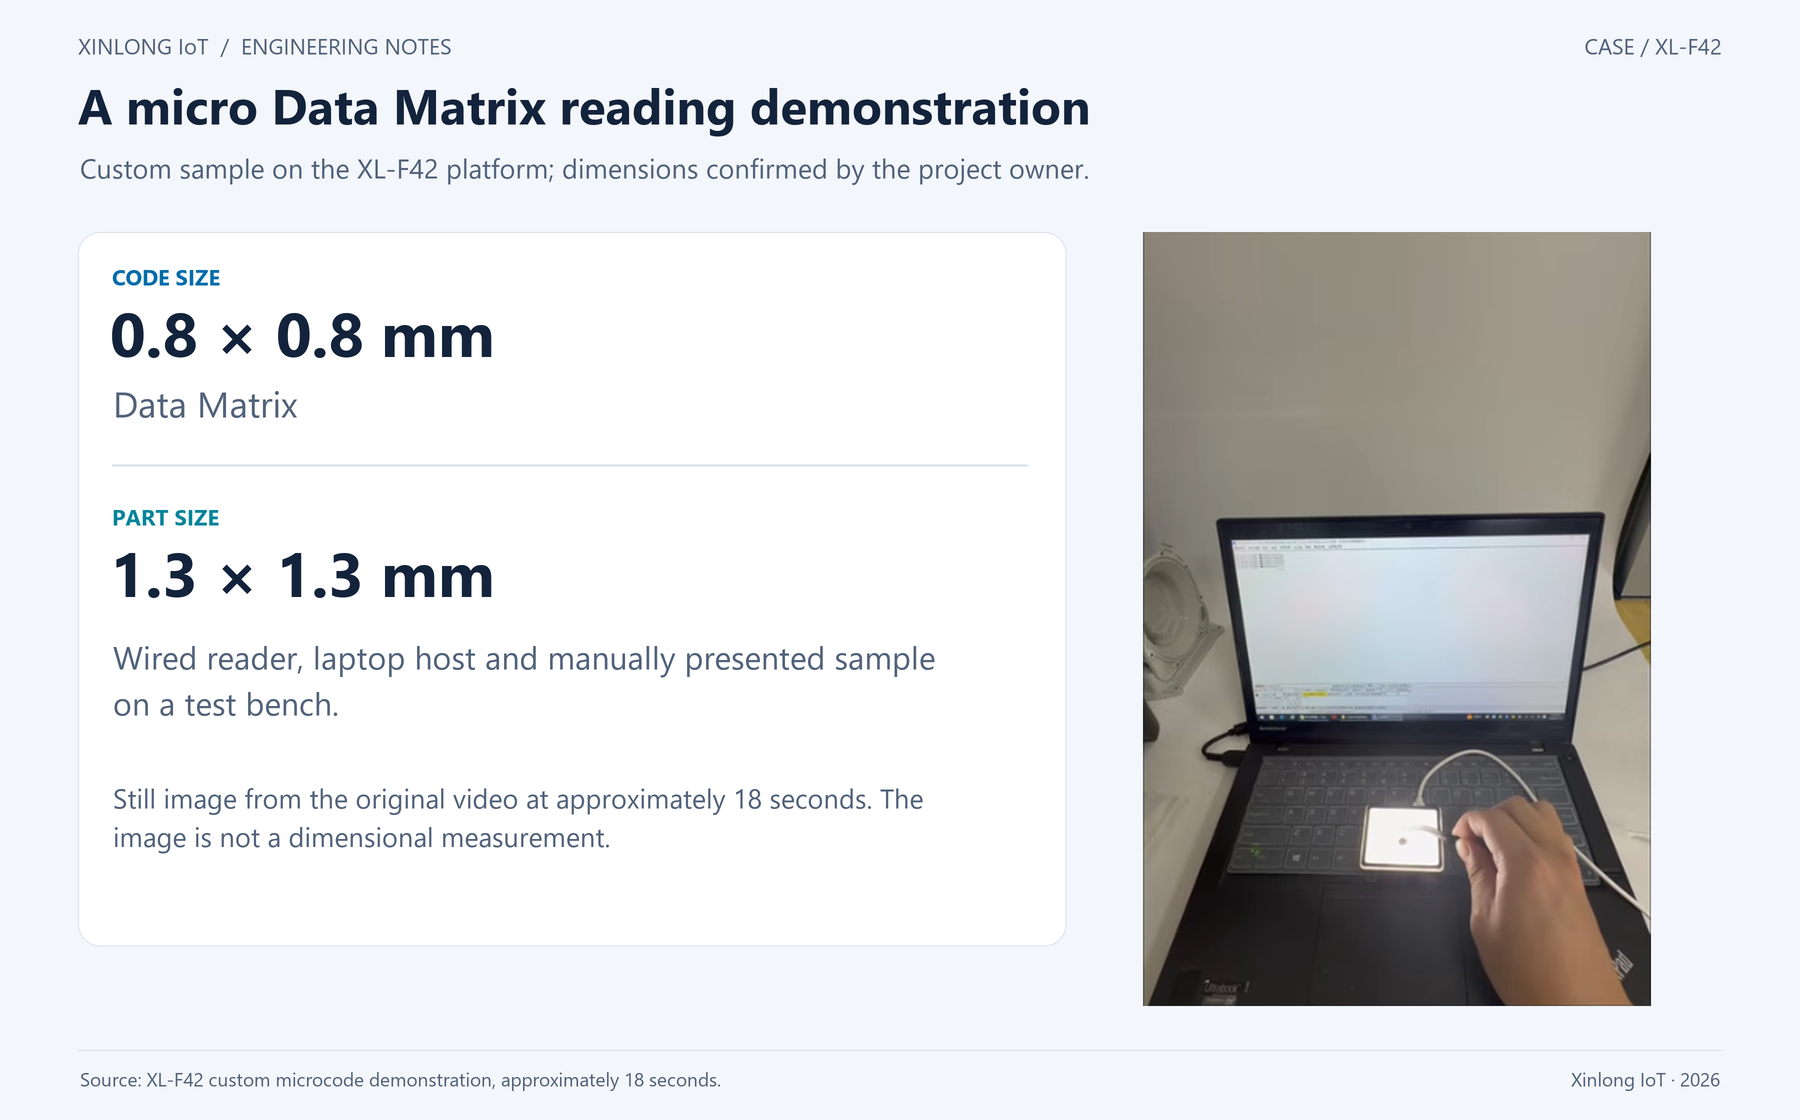
1. Separate part size, symbol size and module size
The 1.3 × 1.3 mm part size describes the object carrying the code. The 0.8 × 0.8 mm symbol size describes the overall barcode. A symbol module, also called a cell, is one of the individual light or dark elements within the Data Matrix. Its nominal physical size is the X-dimension.
For a regular square symbol, the geometric relationship is:
X = L / N

L = symbol edge length, excluding the external quiet zone
N = total modules along that edge, including finder and timing patterns
X = nominal module dimension
At the same overall symbol size, a larger matrix contains smaller modules. Two samples described as “0.8 mm Data Matrix codes” can therefore place different demands on the imaging system.
Before using the formula, confirm the actual matrix dimensions and whether the supplied 0.8 mm measurement includes any external quiet zone. The case dimensions alone do not establish the X-dimension.
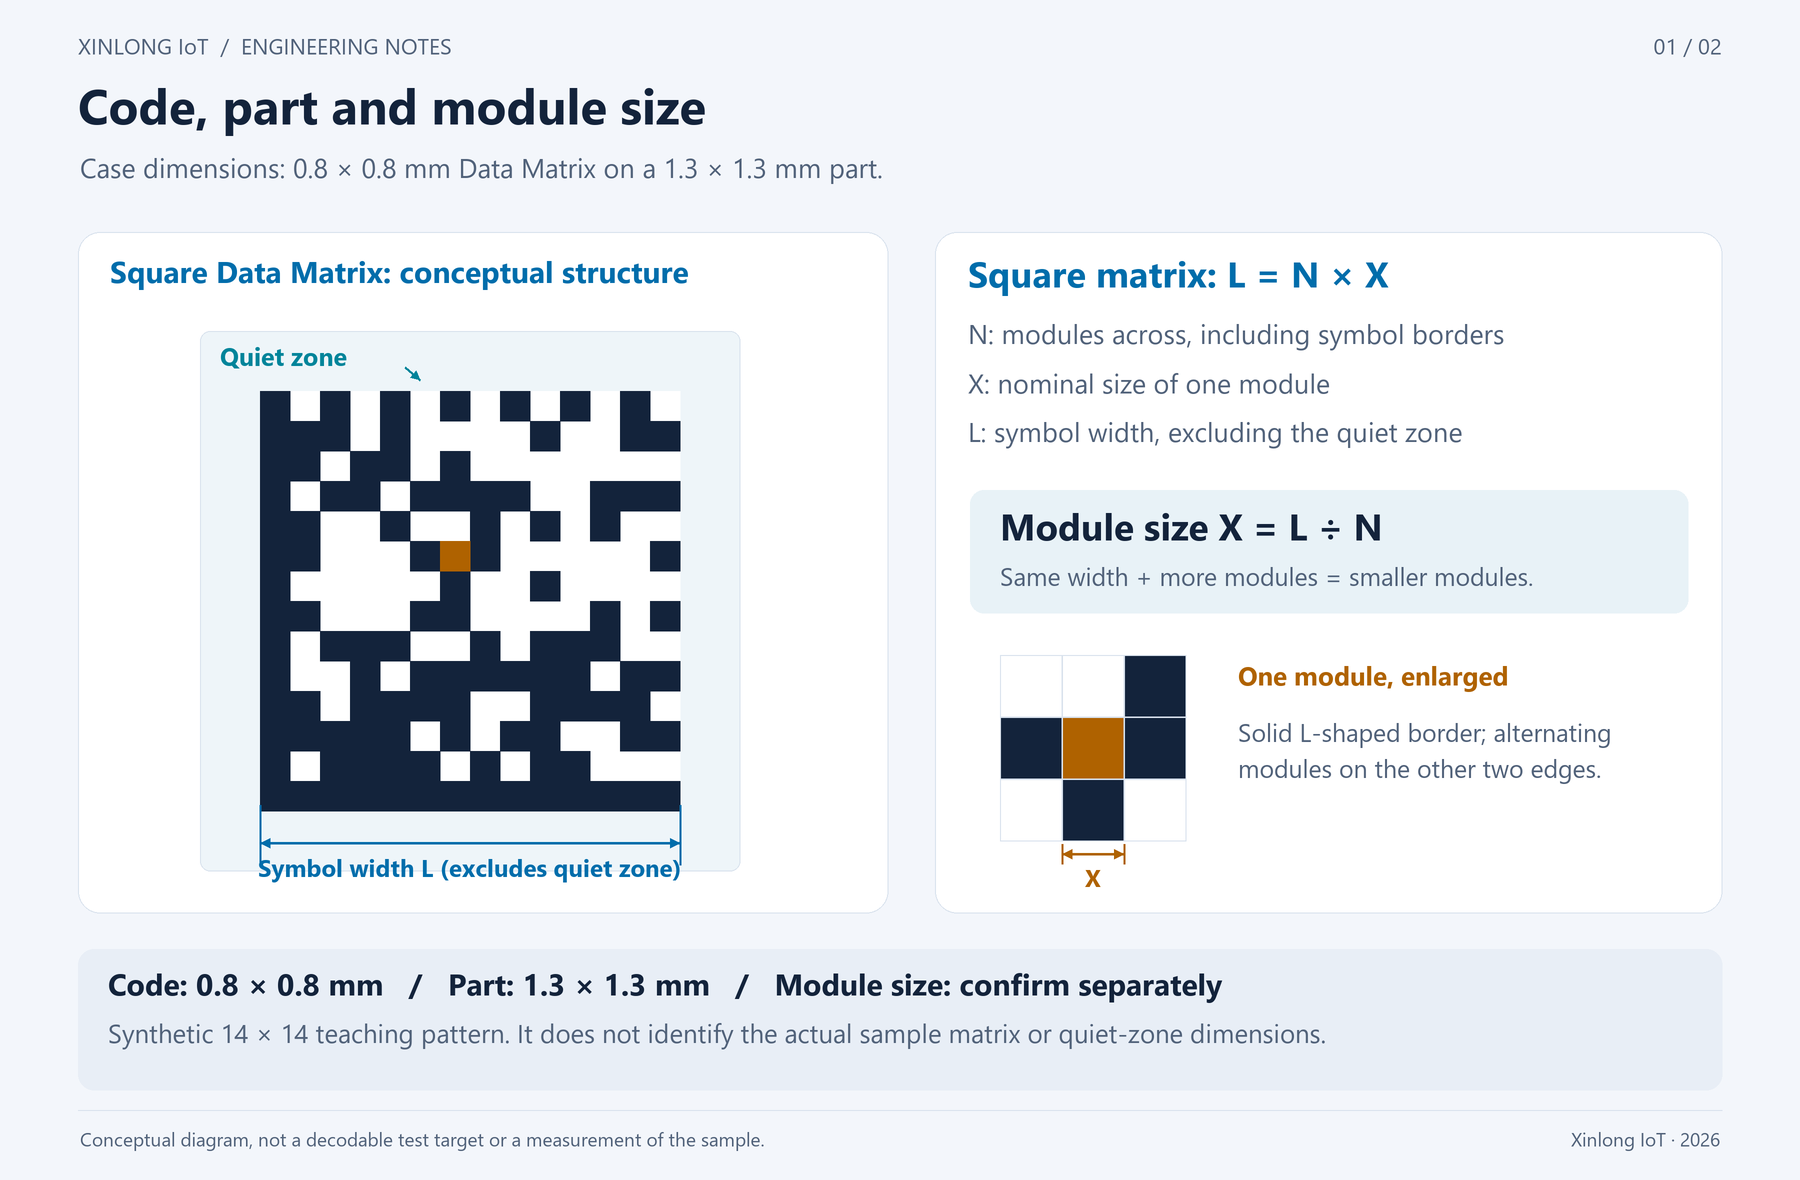
The quiet zone is the clear area surrounding the symbol. Its suitability depends on the code's position, surrounding marks and relevant application requirements. Subtracting the code width from the part width does not establish a usable quiet zone on every side.
Supply the physical sample together with its expected decoded data, material and marking process. Include representative variation from production batches so the evaluation covers more than one ideal specimen.
2. Check pixels per module and optical detail together
A sensor's total pixel count describes the available image sampling. For a micro Data Matrix application, engineers also need to know how much of that image the actual symbol occupies.
If the symbol spans P pixels along an edge containing N modules, its average sampling can be estimated as:
Average sampled pixels per module ≈ P / N
Measure P and N in the same direction and exclude the external quiet zone from both. This approximation assumes a nearly frontal view with a similar local image scale across the symbol.
The ratio helps describe sampling, but it does not supply a universal decoding threshold. Focus, lens performance, glare, noise and damaged module edges can change the result even when two images have the same average pixels per module.
At a fixed output image size, a smaller object-space field of view can make the same physical symbol occupy more pixels. That benefit still depends on sharp imaging and adequate contrast. It also needs to coexist with the required positioning tolerance and complete symbol coverage.
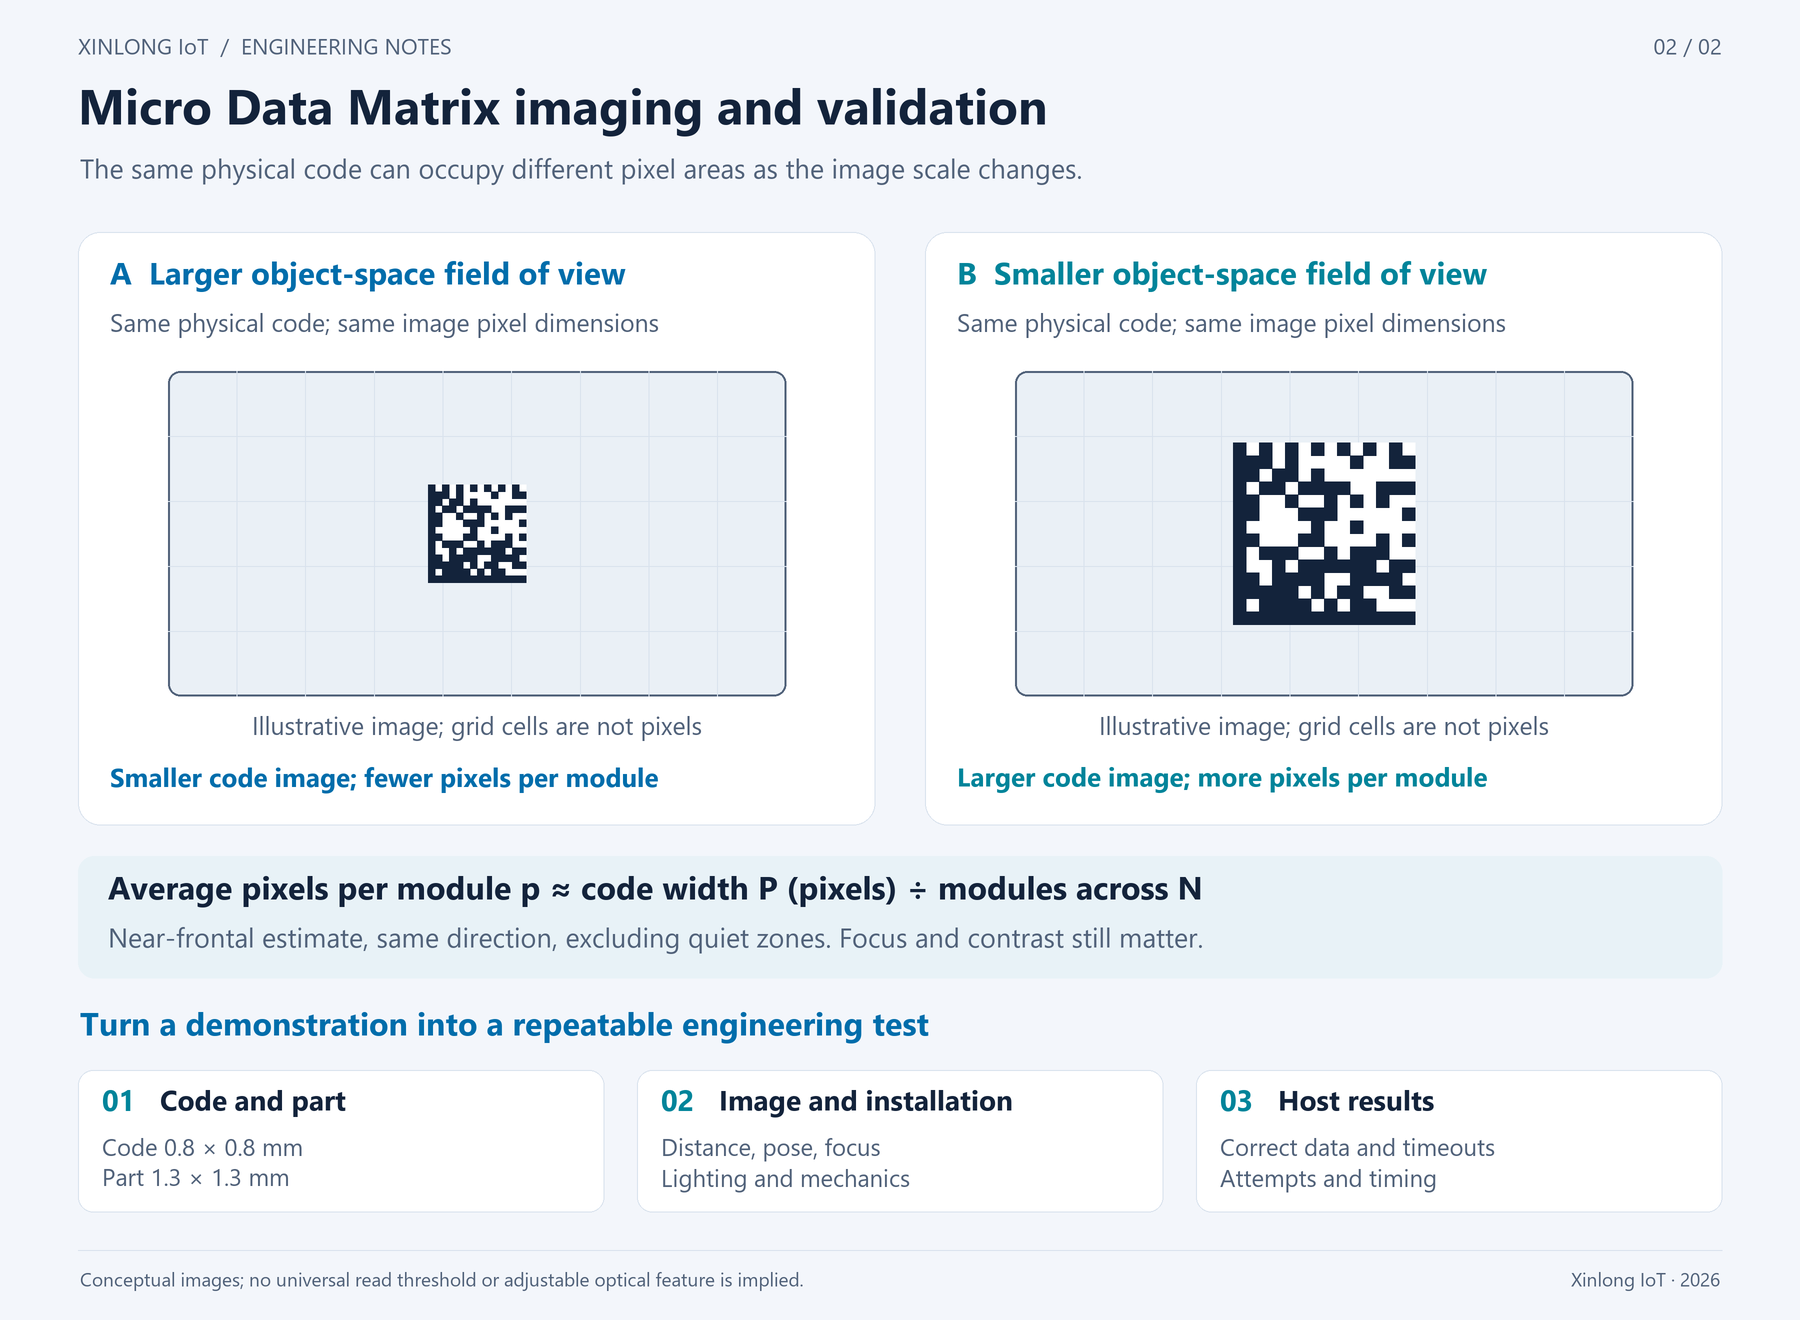
Moving the reader closer can take the target outside its useful focus range or alter the illumination. Evaluate the specified working conditions for the custom configuration, then inspect the actual sample image and decoded output.
3. Make the working distance and mounting repeatable
A handheld bench presentation helps locate workable conditions. An integrated device needs to reproduce them through its mechanical design.
Define the distance reference
State where the working distance is measured from. A housing face, a lens reference plane and a supplier-defined datum can produce different numbers for the same setup. Use one documented reference throughout the sample report and mounting drawing.
Check the nominal distance together with height variation, lateral offset and presentation angle. A successful read at one position provides a point to investigate; the device requires a usable range that covers its assembly and operating tolerances.
Test the actual material and surface
Paper, plastic and metal can produce different reflections and edge contrast with the same encoded content. If the final application uses direct part marking (DPM), evaluate samples with the intended material, marking process and surface finish. The present bench clip does not establish performance on metal DPM, transparent parts, curved surfaces or contaminated marks.
Add the final window and fixture
Start with a documented bare reader baseline, then introduce the fixture, protective window and enclosure. These components can alter reflections, illumination coverage or the visible area. Testing each stage helps identify where a change in performance begins.
4. Keep the platform specification and custom sample record separate
The demonstrated unit is a customer-specific sample based on XL-F42. A project record should identify its delivered configuration and the conditions used to test it.
Scroll horizontally to view all columns. Focus the table to use arrow keys.
| Item | Confirmed case information | Record for the OEM evaluation |
|---|---|---|
| Reader | Customer-specific sample based on XL-F42 | Delivered version and configuration |
| Data Matrix | 0.8 × 0.8 mm overall size | Measurement boundary, matrix dimensions and X-dimension |
| Part | 1.3 × 1.3 mm | Code position, surrounding area and locating method |
| Setup | Wired reader, laptop and manual sample presentation | Distance datum, mounting tolerance, light and enclosure |
| Output | Data lines visible in the host window | Comparison with the exact expected payload and saved logs |
Customization can involve several parts of a reader solution. The engineering record should state what changed in this sample. Standard platform specifications should remain attached to their applicable configuration rather than becoming unverified performance claims for the micro Data Matrix case.
5. Define read attempts, timeouts and correct results
Before counting reads, define when one attempt starts, how long it lasts and how the setup resets. A fixed trigger or a clearly specified presentation event makes attempts comparable.
Count a correct read when the host receives the exact expected data within the allowed time. Record timeouts, incorrect outputs, duplicate reports and communication faults separately. Repositioning the sample until it reads is useful during setup, but a repeatability test needs predefined conditions.
Scroll horizontally to view all columns. Focus the table to use arrow keys.
| Test area | Conditions to cover |
|---|---|
| Samples | Actual batches, minimum module size and representative borderline marks |
| Position | Nominal distance, distance tolerance, lateral offset and required angles |
| Assembly | Bare reader, fixture, protective window and complete device |
| Lighting | Intended ambient light and final illumination arrangement |
| Data and timing | Exact payload, timeout count, duplicate outputs and response-time distribution |
Define the timing boundaries as carefully as the read result. A host-measured response can include triggering, acquisition, decoding, data transmission and application processing. Label a reported time according to what was measured.
Match acceptance conditions to the device's operating cycle. A stationary fixture, manually presented part and moving production line have different requirements. Conveyor performance needs its own motion and exposure tests; it cannot be derived from this bench demonstration.
6. Prepare a micro Data Matrix sample evaluation
Send the physical parts with a dimensioned close-up image, expected payload, material and marking details. Add the available installation space, working-distance datum and tolerances, motion conditions, required interface and acceptance criteria.
For the XL-F42 case, the confirmed 0.8 × 0.8 mm code on a 1.3 × 1.3 mm part establishes the scale of the application. The next engineering task is to reproduce its imaging and positioning conditions in the intended device and keep a traceable test record.
Xinlong IoT can review actual micro Data Matrix samples together with OEM mounting and interface requirements. Discuss your sample and integration requirements. Include the code dimensions and part drawing so the evaluation starts with the same measurement definitions.
Related technical guides
- Data Matrix reader selection and application considerations
- Barcode scanner field of view, scan area and code fit
- Barcode scan engine sample validation
Technical references
- GS1 DataMatrix Guideline: symbol structure, X-dimension and quiet-zone concepts. The referenced public Release 2.5 (2018) supports these fundamentals; this case does not claim GS1 encoding or application-standard compliance.
- Edmund Optics: Resolution: optical resolution and image sampling.
- Edmund Optics: Understanding Focal Length and Field of View: field of view and working-distance relationships.